
| Methods |
|
||||
|---|---|---|---|---|---|
| Completed at | Pro Referral (The Home Depot) | ||||
| Final deliverable | Real time performance reports on company intranet |
At the Services department of Home Depot, sales reports were generated weekly. These reports were not always accurate due to the time lapse between report generation and real time sales.
The Services Report tool was developed to allow for real-time performance tracking across all the Home Depot stores.
Goals
- The target users were executives, who want to see an overall performance status of their assigned regions.
- They want to be able to identify top and bottom performers, and compare data on more detailed levels.
- The deeper the level of detail, the more specific the data: region, district, store, department.
Challenges
- Navigation and controls need to be simple, despite there being numerous ways to manipulate the data
- The sheer volume of information can overwhelm users
Explorations
This phase focused on figuring out the navigation and displaying data on the top level.
Idea 1 – All filters on top
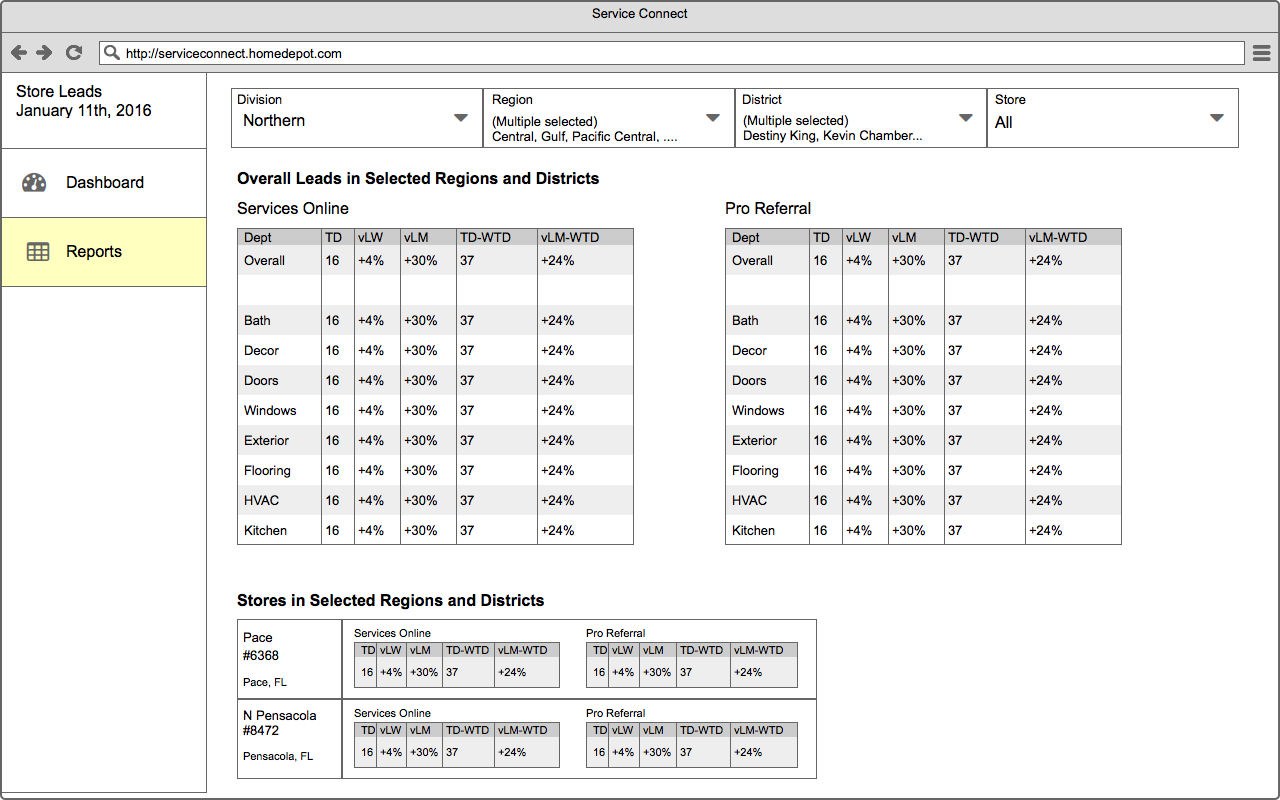
The top menu houses the 4 layers of filters that can be selected.
The resulting 2 sets of tables (one in overall view and another in detail view) can be confusing.
It is not clear how one can get from a store view to a department view.
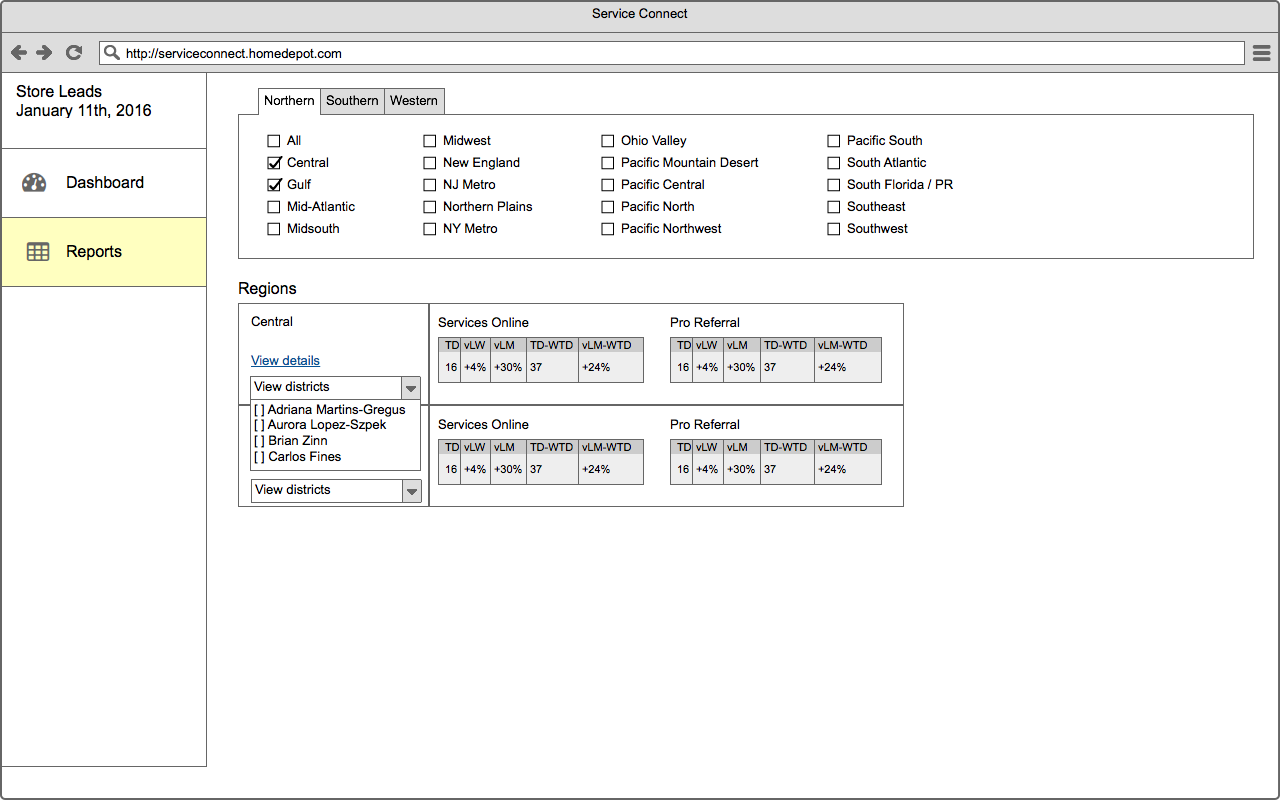
Idea 2 – Separate search & filter
This version utilizes a search box mechanism that will display data from specific requests. According to our interviews, managers sometimes want to just browse around instead of looking up certain districts or stores.
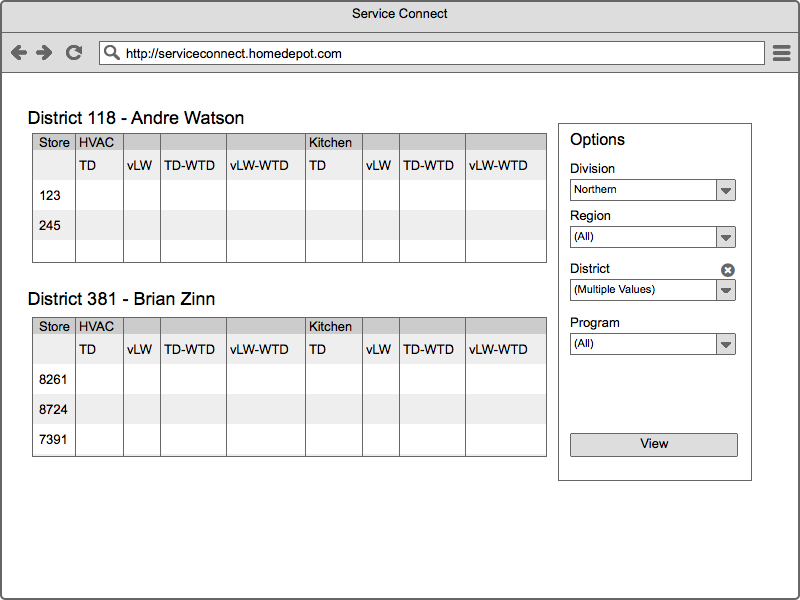
Idea 3 – Drop down filter to see details
In this view, managers looks at overall stats by default, unless they specify which stores to look at. Like the previous version, we got feedback that managers prefer to use this tool to browse instead of search.
Final Deliverable
Navigation
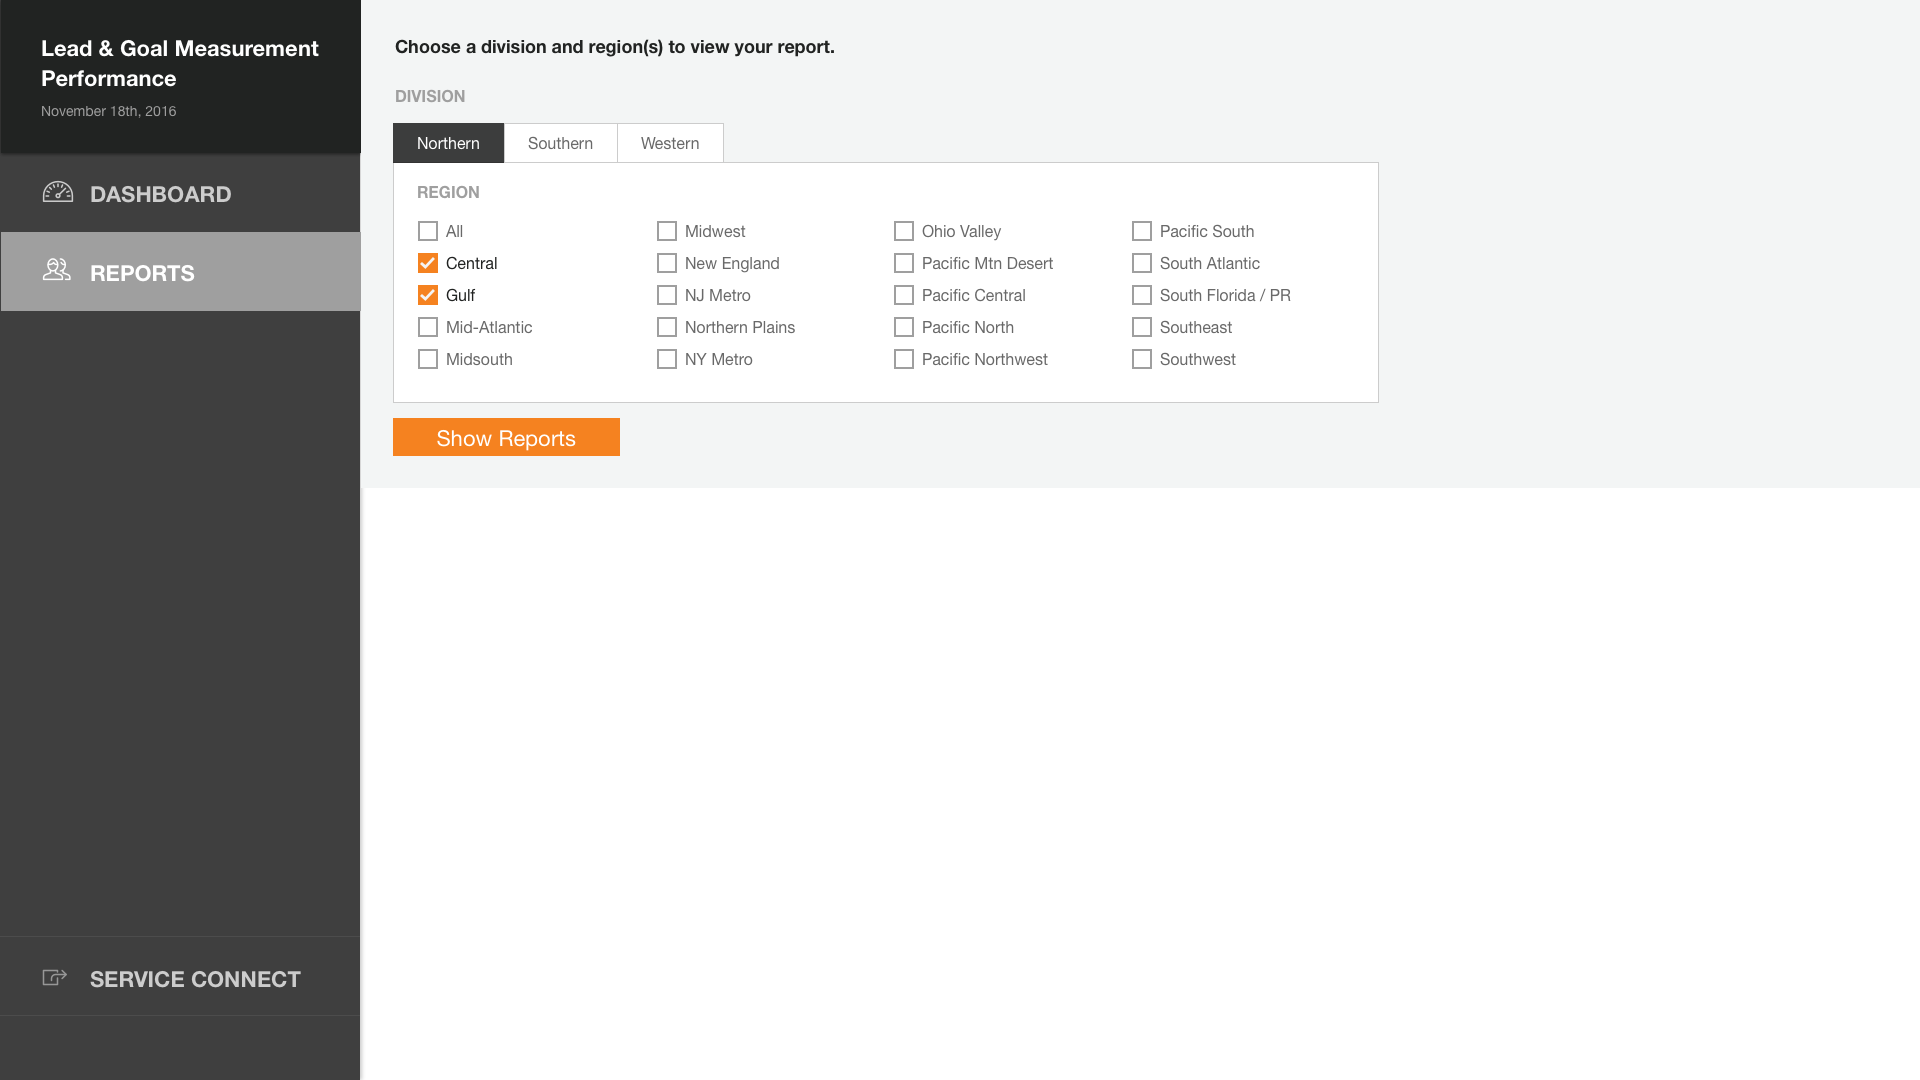
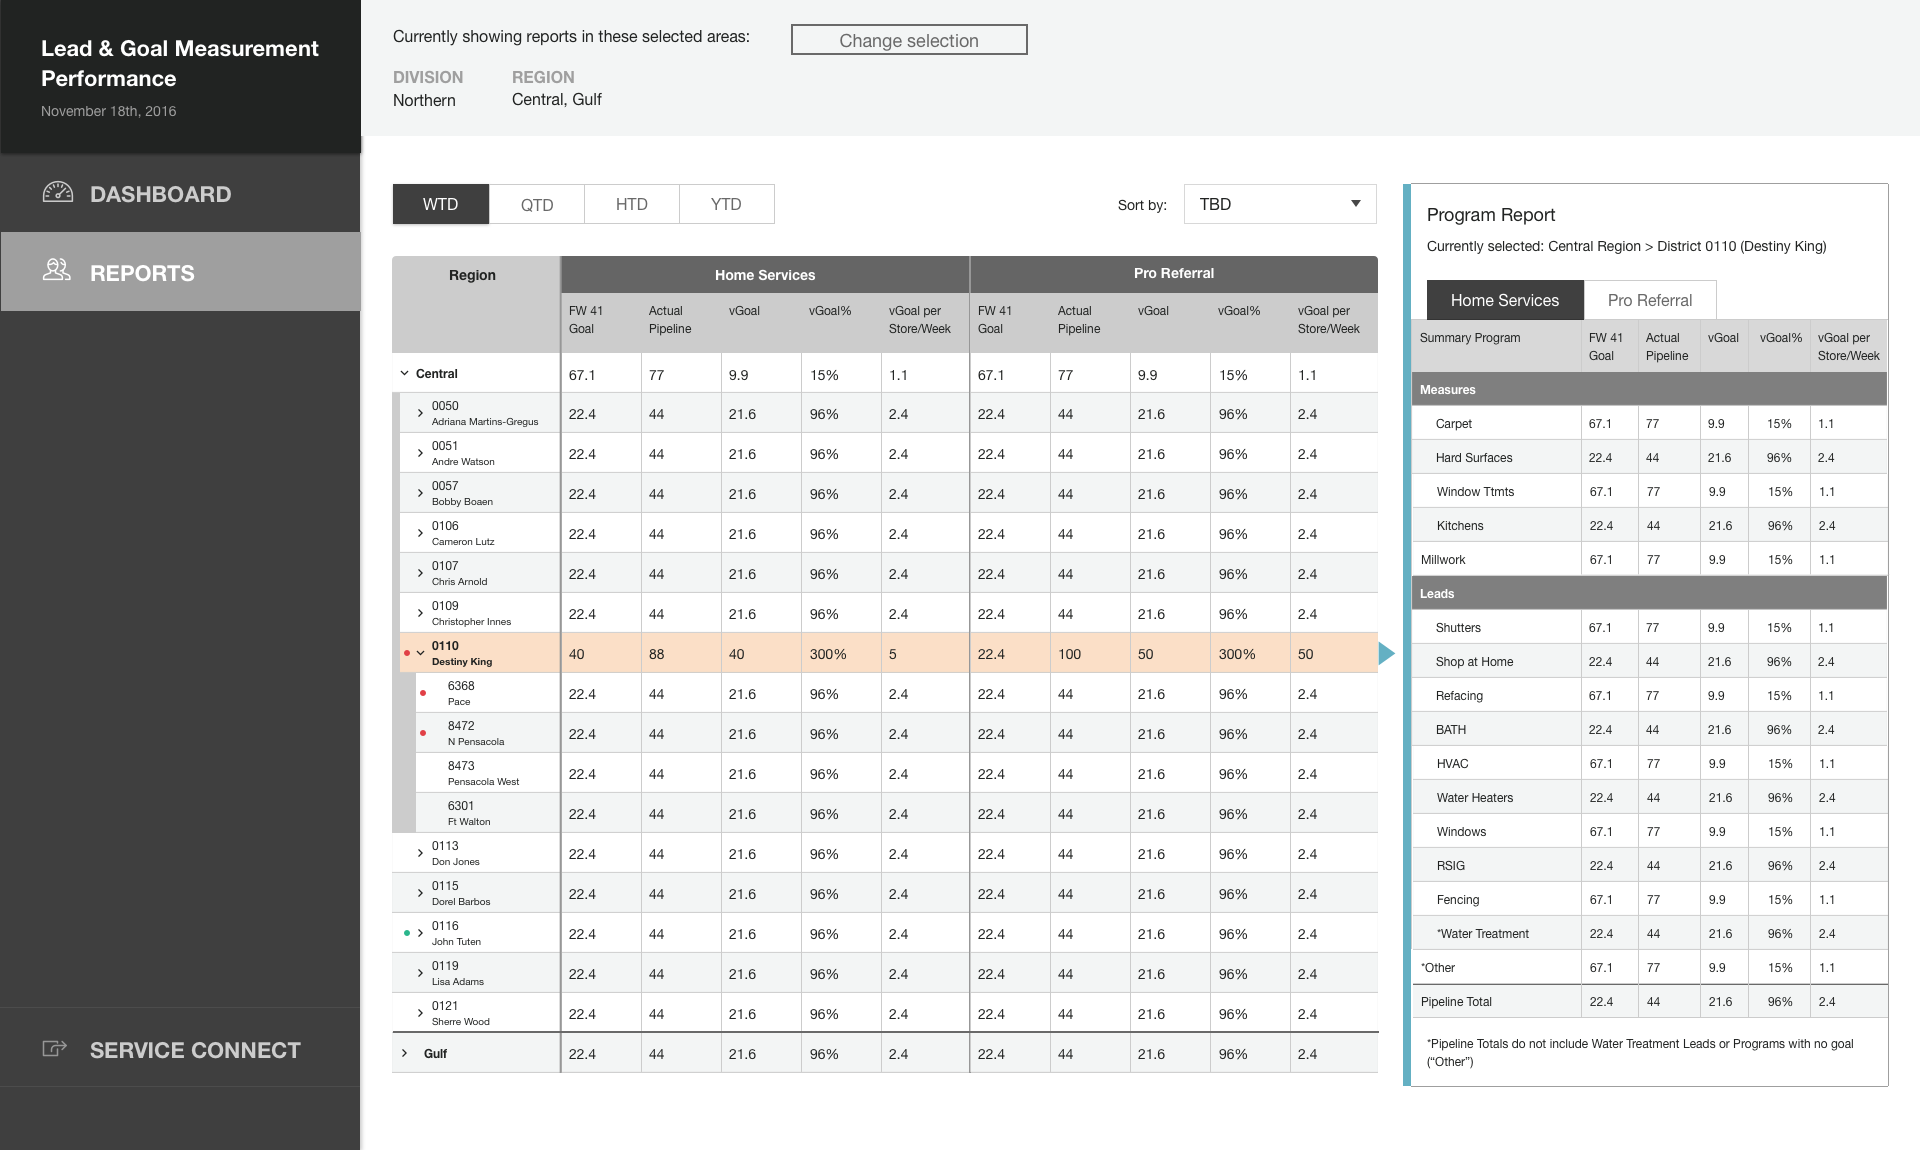
All the data are shown on the same page, which makes the tool easier to navigate and more versatile for comparisons.
Layers of filter are separated and placed according to frequency of usage. Most users are concerned with specific districts or stores and are unlikely to change higher level settings (division, region) once they have been set.
Performance reports
The performance reports are split into two views.
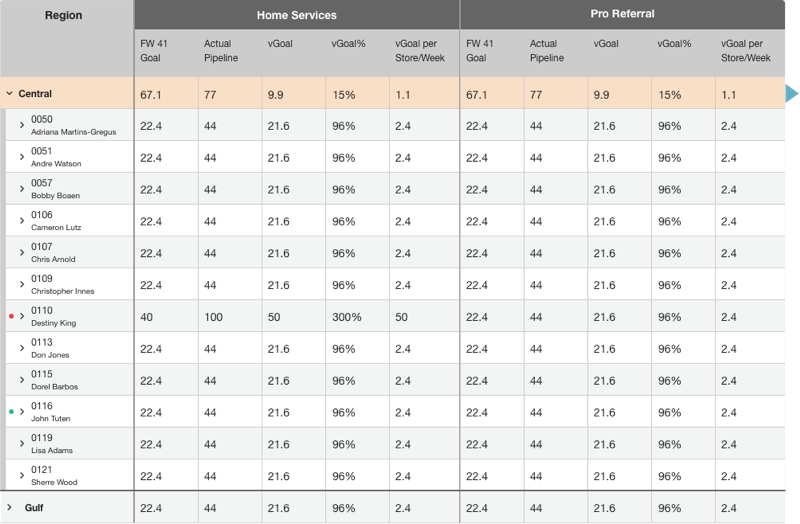
The left shows overall performance. The table starts with a higher level, performance by region. Users can expand the table further to see the overall performance by district or store.
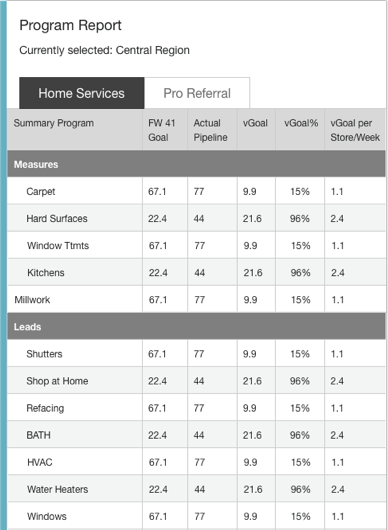
Program Report (right) shows performance breakdown by department. It is updated when users select an item on the left table. They can view program reports across regions, districts, or stores.
At-a-glance indicators
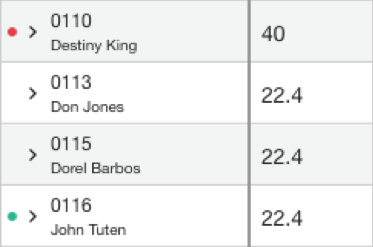
At each level of the table, indicators show the top performer or underperformers with regards to the weekly goal.