<rsch>
research overview
We conducted both domain knowledge and onsite field research in parallel, with each component informing the direction of the other.
domain knowledge
We familiarized ourselves with the current landscape of collaboration through literature review and comparative tool analysis. We leveraged this background research when gathering participant data, synthesizing research findings, and finally developing suggestions for potential solutions.
literature review
For our literature review, we reviewed academic papers about knowledge sharing, expert finding, tool configuration, and virtual teams. The goal of was to inform our design choices by developing an understanding of what researchers already know about the topics related to our scope.
collaborative tool
landscape analysis
We identified eight major goals in collaborative work and examined the current best-in-class tools for accomplishing each goal. We used our landscape analysis to evaluate how well these tools achieve these goals, what common challenges remain, and what opportunities exist in this space.
field research
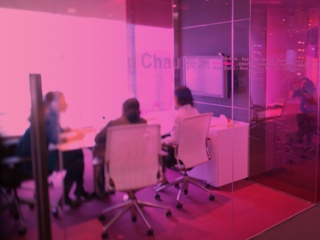
Our field research consisted of various interview and observation techniques with individual employees from a diversity of roles and experiences. We also led a group design session with six employees, during which they participated in several interactive activities.
guided storytelling
Guided storytelling is a type of semi-structured interview method we employed to gather data based on participants’ recounting of specific stories and experiences. In keeping with our research goals, we focused our questions on collaborative themes and asked participants to tell us stories about working with other people, accomplishing tasks, and challenges they faced.
contextual inquiry
Contextual inquiry is a form of observation that takes place in the context of the participant’s daily workflow. We observed participants work as they normally would and interrupted on occasion to ask clarification questions. These contextual inquiries highlighted collaborative processes employees used, many of which may never have surfaced in a more structured interview.
business origami
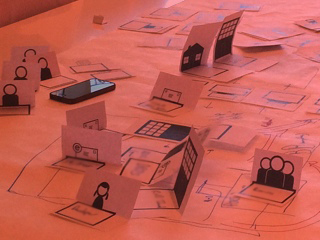
Business Origami is a method we employed to physically model a complex system and how people and things flow between areas as a result of various actions. Participants and researchers both gained insight into how a system is structured by seeing it represented in this new visual way.
i like / i wish
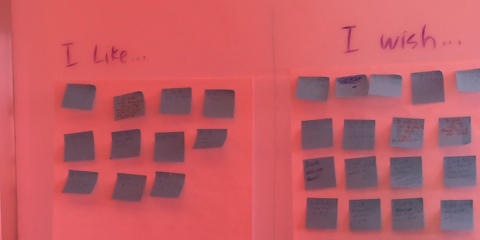
The I Like, I Wish method is a way to quickly generate a large amount of data on how a group of people feels towards a certain product or design. We asked participants to write down on Post-It notes as many statements as they could that began with “I like...” or “I wish....” The group then worked together with our team to facilitate a conversation about the trends that emerged.
love / breakup letter
Our team asked participants to write a love letter or a breakup letter to a particular product, describing their feelings towards it. We used this method to move away from concrete facts of how people interacted with their products, and tried to uncover the human side of using a product.
relationship mapping
We asked participants to map out their office relationships in order to identify the networks that exist between teams and employees at Bloomberg. On a sheet of paper, they drew themselves in the middle, and then connected themselves to various other groups within their workplace.
<syns>
synthesis
After completing our on-site field research, we synthesized and analyzed our data through a variety of methods. From this consolidation, we came up with overall findings and identified a number of design opportunities.
modelling
From our contextual inquiry data, we modeled overall interactions as well as isolated instances of collaborative activity in flow and sequence models. Flow models visually presented a high-level picture of how Bloomberg employees interacted with other people, their tools, and their environments. Sequence models listed actions step-by-step as they occurred from the perspective of the participant. These models allowed us to actually see where and how breakdowns occurred for the participants we observed.
affinity diagramming
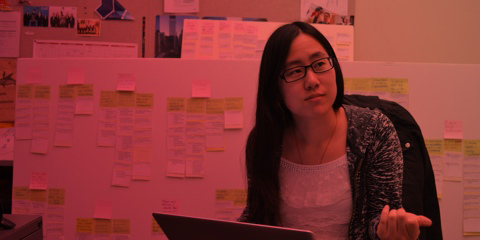
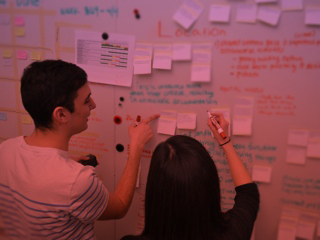
Affinity diagramming is an organizational method we used to group captured data notes into a hierarchy of key points. We parsed over 750 of these notes from our various research activities and arranged them into similar categories that capture actions, thoughts, or feelings from the perspective of our study participants.
visioning
Based on our findings and insights, we generated over 100 different visions, or high-level conceptual design solutions. We narrowed down these visions through a process of iterative creative brainstorming and evaluation. Finally, we illustrated our top seven ideas into a series of scenarios in order to explore different functionality, features, and potential use cases.
